 Ozmium Docs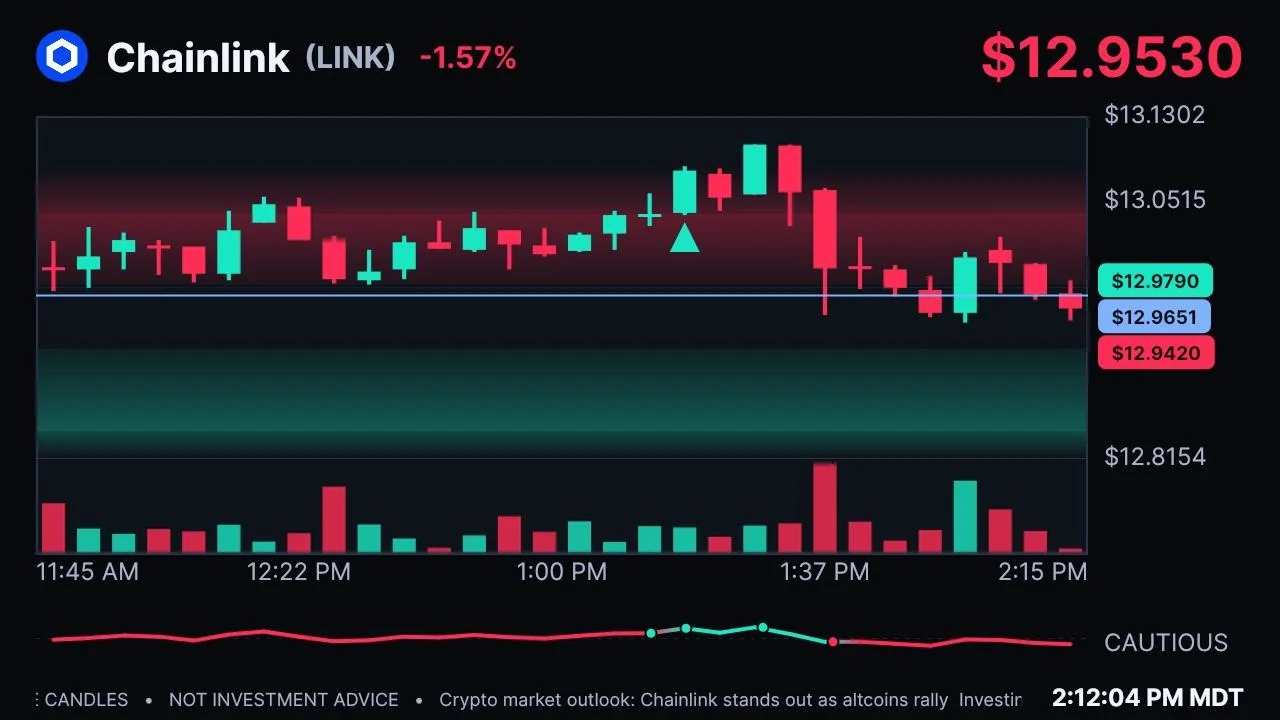
Reading The Stream Chart
What Ozmium adds to the candle chart on the livestream - the buy and sell triangles, the mood line and its dots, the shaded levels, the price tags, and the footer.
You already know how to read candles and a fear and greed line. These are the things Ozmium adds.
Triangles
A green triangle below a candle is a buy call; a red one above a candle is a sell. Each one prints when its candle closes, never while the candle is still forming.
On crypto and stocks, a buy is a close above the highest high of the previous 20 candles while the 20-candle average sits above the 50-candle average; a sell is the mirror image. On forex, commodities and indices, at least two reversal rules have to agree on the same candle. The next call on a chart comes ten or more candles later.
The Mood Line
The line under the chart is this market's own 14-candle RSI, not a published fear and greed index. Greed is at the top, fear at the bottom, and the dashed line is the middle. The word beside its latest point reads it: FEAR, CAUTIOUS, NEUTRAL, CONFIDENT or GREED.
The Dots
Each dot is one call, placed where the mood stood when it was made. Green is a buy and red is a sell. Dots come from five candle sizes, from 1 minute to 4 hours, so not every dot has a triangle above it. When several sizes call at the same moment, their dots stack, with the slowest candle size at the top. The line takes the colour of the latest call.
Shading
Red shading marks resistance above the price and green marks support below it, where recent swings turned. Only the candle size whose level sits nearest the price is shaded.
Price Tags
The green tag is the newest candle's high and the red tag is its low. The blue tag, and the blue line across the chart, is the mark price: the venue's price that liquidations are calculated from.
Header And Footer
The percentage beside the name is the day's move. The chart picks its own candle size and names it in the footer, next to a headline from a trusted outlet when there is one. Volume marked FUTURES comes from currency futures, because spot forex publishes none.
Nothing on this chart is investment advice.